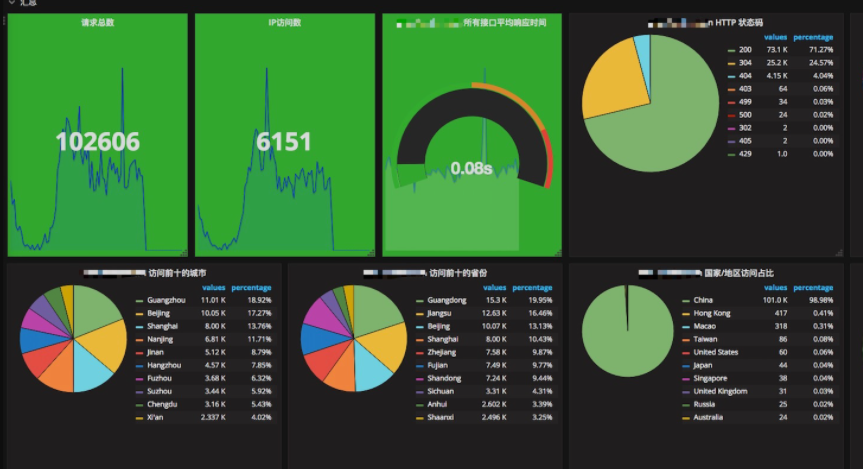
What is Grafana
Grafana OSS is an open source software that lets you query, visualise, alert on, and understand your data regardless of where it’s kept. Grafana allows you to create, explore, and share all of your data via beautiful, adaptable dashboards.
After you’ve installed Grafana and created your first dashboard according to the instructions in this article, When you first start using Grafana, you’ll have a lot of alternatives to select from, depending on your needs. You can make a playlist, for example, to view weather data and statistics about your smart home. You can set up provisioning and authentication if you’re an enterprise administrator who manages Grafana for different teams.

In the sections below, you’ll find an overview of Grafana’s capabilities as well as links to product documentation to help you learn more. Check out our Grafana Community forums for more tips and ideas.
Analyze the metrics, logs, and traces
Adhoc queries and dynamic drilldown allow you to go deeper into your data. Compare different time spans, queries, and data sources side by susing ad-hoc queries and dynamic drilldown, you can learn more about your data. Compare different time periods, queries, and data sources side by side in a split view. For further information, see Explore.
Alerts
Grafana alerts can be sent to a variety of alert notifiers, including PagerDuty, SMS, email, VictorOps, OpsGenie, and Slack.
If you prefer additional routes of communication, alert hooks allow you to construct different notifiers with a little code. Create visual alert rules for your most critical data.
Annotations
Graphs can be annotated with rich events from various data sources. When you hover your mouse over an event, you’ll see all of the event’s metadata and tags.
This feature, which appears in Grafana as a graph marker, is useful for correlating data in the event that something goes wrong. You can either manually write annotations (control-click on a graph and type some text) or fetch data from any data source. See Annotations for more details.
Dashboard Variables
You can utilise template variables to design dashboards that can be reused for a variety of purposes. These templates don’t have hard-coded values, so if you have a production server and a test server, you may use the same dashboard for both.
Templating allows you to dig down into your data, for example, from all data to data from North America, Texas, and beyond. You may also distribute these dashboards across your organization’s teams—or, if you produce a brilliant dashboard template for a popular data source, you can make it available for the entire community to alter and use.
Configure Grafana
If you’re a Grafana administrator, you’ll want to get to know the Grafana configuration options and the Grafana CLI intimately.
Configuration refers to both configuration files and variables in the environment. Default ports, logging levels, email IP addresses, security, and other options are available.
Dashboards and plugins can be imported
Hundreds of dashboards and plugins are available in the official library. Every week, new ones are added thanks to the passion and momentum of community members.
Authentication – What is Grafana
Grafana allows you to map people to organisations and supports various authentication mechanisms such as LDAP and OAuth. For further information, see the User Authentication Overview.
You may also map users to teams in Grafana Enterprise: Grafana allows you to map the teams in your internal systems to Grafana teams if your firm has its own authentication mechanism. As a result, you’ll be able to automatically grant people access to the dashboards that are specific to their teams. For further details, see Grafana Enterprise.
Provisioning – What is Grafana
While it’s simple to construct a single dashboard by clicking, dragging, and dropping, power users who need a lot of dashboards may want to utilise a script to automate the process. Grafana allows you to script anything.
For example, if you’re creating a new Kubernetes cluster, you can also create a Grafana automatically with a script that specifies the correct server, IP address, and data sources and locks them in so users can’t change them. It’s also a means to take command of a large number of dashboards. For further information, see Provisioning.
Permissions – What is Grafana
When a company has one Grafana and numerous teams, it’s common for them to want to be able to keep things separate while yet sharing dashboards. If you’re using Grafana Enterprise, you can establish a team of users and then specify permissions on folders, dashboards, and even data sources.
Please follow our posts on our website


